
📌 Key Ideas
- 📈 Trend Direction: Follow uptrend, downtrend, or sideways market
- 🧱 Support Level: Price floor where buyers enter
- 🚧 Resistance Level: Price ceiling where sellers dominate
- 📊 Trendlines: Confirm trend strength and direction
- 🚀 Breakouts: Strong moves after key level breaks
In trading one thing you need to remember is that the trend is your friend. This is something that comes from the Dow Theory, which says that markets always move in trends. If you want to be a trader you need to understand what trend support and resistance are and how to use technical analysis. This will help you go with the market direction and not lose money when you do not have to.
To really get this you should also learn about things like the RSI and the MACD. You can find out more about these in our guide called Top 10 Trading Indicators, which’s, on the website. This guide will really help you with the trend and how to use it to trade.
Table of Contents
What is Trend Support Resistance Technical Analysis?
The trend support resistance analysis is a way to figure out which direction the market is going and to find the important prices where the market actually does something. It puts together looking at trends and the support and resistance levels to make trading more accurate.
Prices go up and down in a zigzag making highs and lows. This is how traders can see what is going on in the market..
Key things to know about trend analysis are:
- Zigzag Movement: The prices do not move in lines, they go up and down in a zigzag.
- Market Direction: Trend analysis helps us see if the market is going up or down or just staying the same.
- Trading Advantage: Improves decision-making
- Momentum Focus: Aligns trades with market strength
Types of Trends in Technical Analysis
To really get good at analysis you need to know about the different types of trends. This is because each type of trend is unique and you have to use an approach with each one. Trend support and resistance are things to consider when you are looking at trends. The thing is, trend support and resistance work differently with each type of trend. So it is really important to understand the types of trends if you want to be good at technical analysis and use trend support and resistance effectively.
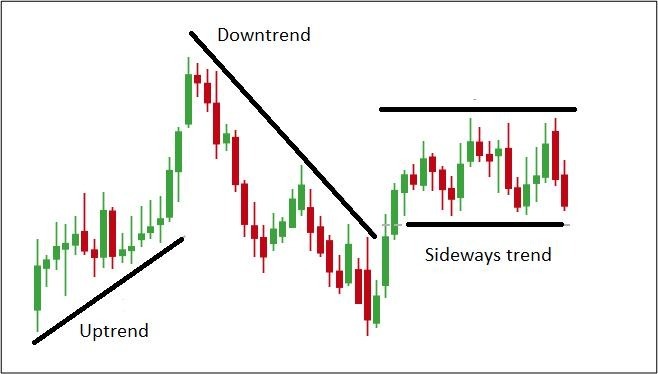
1. Uptrend (Bullish Trend)
Uptrends occur when there is a rising price pattern due to high levels of demand. Uptrends represent the best scenario under which traders should take long positions in accordance with the trend.
Such strategy has been embraced by most traders when picking stocks such as those highlighted in “Top Defence Stocks in India 2026“.
Key Features of Uptrend
- Higher Highs: Each successive high is higher
- Higher Lows: Each successive low is higher
- Strong Demand: Buyers dominate
- Best Strategy: Buy on pullbacks
2. Downtrend (Bearish Trend)
Downtrend is characterized by continuous falling prices because of the pressure from selling. It implies weak market sentiments and abundant supply.
If you wish to understand more about the behavior of the market, you may refer to the following concepts from the Price Action Trading Guide.
Key Features of Downtrend
- Lower Highs: Peaks decrease over time
- Lower Lows: Prices keep falling
- Strong Supply: Sellers dominate
- Best Strategy: Sell or short
3. Sideways Trend (Consolidation)
When the price of something moves up and down a little but does not really go anywhere that is what people call a trend. This happens when the market is not sure what to do. The price just moves within a range and does not have a clear direction. This kind of thing often happens before the price suddenly moves a lot, which is called a breakout.
People who trade often get ready for a breakout by using plans that are explained in the Breakout Trading Strategy Guide.
Key Features of Sideways Trend
- Range Movement: Price stays within levels
- Low Momentum: No strong direction
- Market Balance: There are as many people wanting to buy as there are people wanting to sell.
- Best Strategy: The best thing to do is wait for a breakout to happen. A sideways trend is a time when the market is balanced and the price of something is not moving much. The best thing to do during a sideways trend is to wait for a breakout.
Top 10 Technical Indicators for Trading: Beginner’s Guide 2026
Understanding Trendlines in Technical Analysis
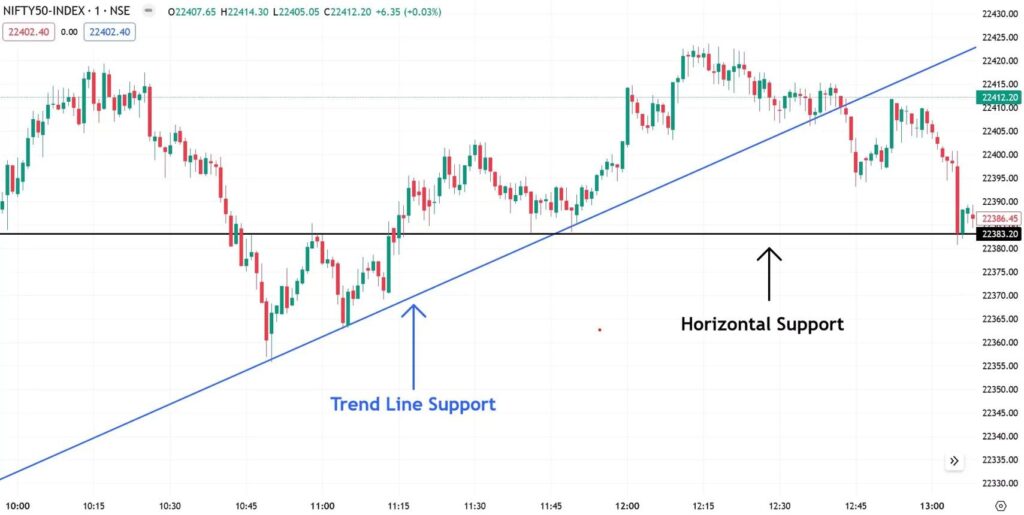
Trendlines are really important in analysis especially for spotting support and resistance.
They help traders figure out where the market is headed and how strong the trend is by connecting price points.
To be reliable a trendline needs at least three points where the price has touched it.
Key Elements of Trendline
- Starting Point: Beginning of trend
- Confirmation Point: This point helps confirm which direction the trend is going.
- Validation Point: When the price touches the trendline for the time it shows how strong the trend is.
- Usage: Helps identify entry and exit
Support and Resistance Explained
Support and resistance are really important when we talk about trend support resistance analysis. These are the prices where people in the market react because of the imbalance between demand and supply.
1. Support
Support is the level where price stops falling due to increased buying interest.
Key Features of Support
- Price Floor: This is the point where the price does not fall any more.
- Buyer Zone: Buyers enter the market.
- Reversal Point: This is the point where the price often goes back up.
- Trading Use: This is a level to buy because the Support is a good price to buy at. Support is where people think the price will not go down any more so they buy. Support is like a level that holds the price up.
2. Resistance
When the price of something gets to a point it stops going up because people start selling.
Key Features of Resistance
- Price Ceiling: This is the point where the price stops going up.
- Seller Zone: This is where the sellers are in charge.
- Reversal Point: This is where the price might start going down.
- Trading Use: This is a level to sell at when you are trading Resistance. Resistance is a thing to think about when you are looking at Resistance and trying to figure out what to do. Resistance is like a wall that stops the price from going up any because of the selling pressure, from people who are selling at that level of Resistance..
Top 10 stocks for options trading in India 2026
Breakouts and Role Reversal
Breakouts are really important when we look at trends and how prices move. This is because breakouts happen when the price of something goes past a level and it does so with a lot of force.
Key Breakout Concepts
- Bullish Breakout: This is when the price goes above a level that it could not go past before.
- Bearish Breakdown: This is when the price goes below a level that it was staying above.
- Role Reversal: This means that what was stopping the price from going up will now make it go up and what was making it go up will now stop it.
- Trading Opportunity: Because when the price breaks past a big level it will often keep moving in that direction with a lot of force so breakouts are really important, in trend and price analysis and breakouts are one of the things that people who trade look for..
Suggested Read: How to Start Intraday Trading for Beginners
How to Use Trend Support Resistance Technical Analysis Together
Using all these concepts together creates a powerful trading strategy that improves accuracy and reduces risk.
Step-by-Step Strategy
- Identify Trend: Find overall market direction
- Draw Trendlines: Confirm trend strength
- Mark Levels: Identify support and resistance
- Entry Strategy: Decide when to trade. Either when the market breaks out or pulls back.
- Risk Management: Always protect yourself with a stop-loss order.
Suggested Read: How to Invest In Share Market as Beginners
Conclusion
Mastering trends and support and resistance is really important if you want to be good, at trading. This is because it helps traders figure out what the market is doing find times to buy or sell and not lose too much money.
By using trend and support and resistance with the plans and things to help you trade you can get a lot better at trading and feel more sure of yourself.
FAQ – Trend Support Resistance Technical Analysis
Q 1. Define trend support resistance technical analysis?
Ans. Trend support resistance technical analysis is a type of analysis that assists traders in identifying the trend and finding support and resistance zones for better trading decisions.
Q 2. Why is the concept of trend significant for technical analysis?
Ans. This concept is critical in technical analysis since it reveals the general direction of the market. When trading according to the trend in trend support resistance technical analysis, the chances of success become higher.
Q 3. Explain in simplest possible terms what support and resistance mean.
Ans. Support is a zone where an asset fails to go further downward due to buying pressure. On the contrary, resistance is the area where a commodity cannot rise further due to selling pressure.
Q 4. How does a beginner trader apply the concepts of trend support resistance technical analysis?
Ans. A trader can simply identify the trend, find support and resistance levels and open trades in the appropriate zones.
Q 5. Discuss the best approach to using trend support resistance technical analysis.
Ans. In this situation, the most efficient way would be to identify a trend and conduct trades in its direction, particularly on pullbacks at support/resistance or after breakouts from these levels.
Q 6. Define breakout in technical analysis?
Ans. Breakout refers to price moving up past the resistance level or down past the support level with a lot of momentum. Breakouts are very common in trend support resistance technical analysis.
Q 7. Is it safe to rely on trendlines in trading?
Ans. Trendlines are reliable if they have been tested at least three times. They assist in confirming the trend and establishing possible points of entry and exit.
Q 8. Should I perform trend support resistance technical analysis for all trades in my trading career?
Ans. You need to do trend support resistance technical analysis on all trades in your trading career since it makes trading easier in terms of direction and risk management.