
A stock market charts guide can make investing far less confusing for beginners. If you have ever looked at a stock market chart and felt overwhelmed by the lines, colors, and patterns, you are not alone. Stock market charts may look complex at first, but anyone can learn how to read and understand them with a little practice.
Once you begin to understand what a stock market chart is telling you, charts become an interesting and powerful tool. Reading stock market charts is a skill that improves decision-making and helps investors understand price movement instead of guessing.
Stock Market Charts Guide: What Is a Stock Market Chart?
A stock market chart is a visual representation of how a stock’s price changes over time. Think of it as a timeline that shows price movement instead of scenes from a movie. Traders and investors use charts to see whether prices are rising, falling, or moving sideways before making decisions.
Common Types of Stock Market Charts
-
Line charts show closing prices connected by a single line and are useful for spotting overall trends.
-
Bar charts display the opening price, closing price, high, and low for each period, offering more detail.
-
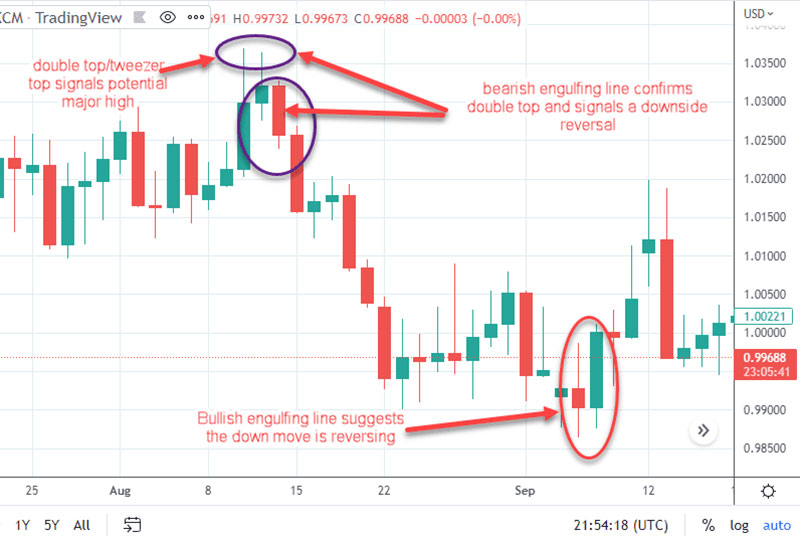
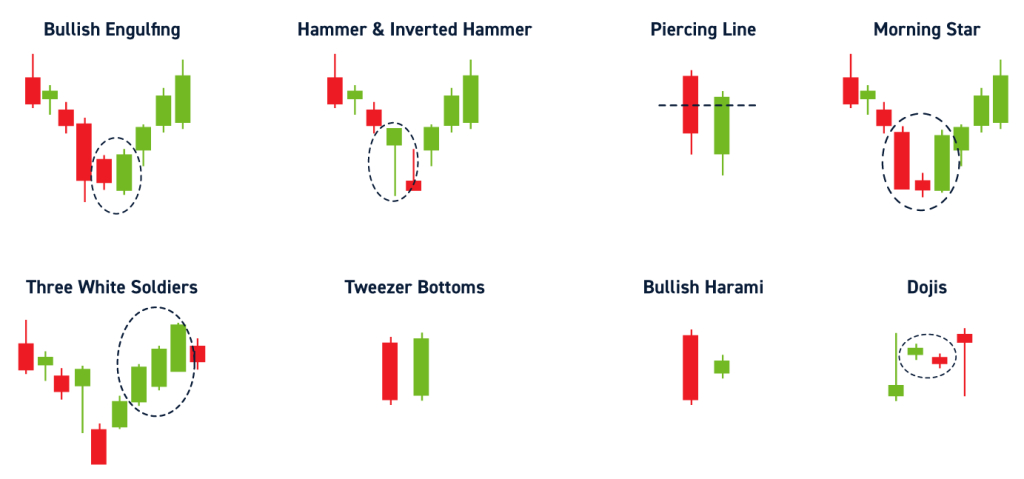
Candlestick charts are the most popular. They clearly show bullish and bearish days and help understand market psychology.
Understanding Timeframes in Stock Market Charts
Timeframes play a key role in any stock market charts guide. You can zoom in to view minute-by-minute price action or zoom out to see trends over months or years.
-
Short-term charts help identify quick trading opportunities but can be noisy.
-
Long-term charts reveal trends and cycles, making them useful for long-term investors.
Always ask yourself what story the chart is telling you—short-term movement or the bigger picture.
Key Elements to Read in Stock Market Charts
Several components help explain price behavior:
-
Volume bars show how many shares were traded and indicate interest or potential trend changes.
-
Moving averages smooth price action and highlight trends.
-
Support and resistance levels act as price barriers where stocks often bounce or reverse.
Together, these elements reflect market sentiment—whether investors are confident, cautious, or uncertain.
Using Stock Market Charts the Right Way
Charts are tools, not predictions. The best results come from combining charts with discipline and patience.
Helpful tips:
-
Do not rely on a single indicator
-
Combine charts with volume and news events
-
Practice patience—trends take time
-
Try paper trading to gain experience without risk
Wrapping Up
Sasvat Invest stock market charts guide shows that charts are not meant to confuse you. With curiosity and practice, charts turn price movements into clear stories. They help you understand what is happening in the market and make more informed decisions.